
This note covers adjustments to rendering load.
The four things I mainly pay attention to when implementing WebGL are rendering load / data size / usability / accessibility.
Main ways to reduce rendering load
First, these are the main ways to reduce rendering load.
| Topic | Load it targets | Method |
|---|---|---|
| Adjusting the rendering resolution | Pixel processing | Optimize the rendering scale. |
| Reducing Shader and texture load | Pixel processing | Optimize the number of texture samples used for a blur, or use GPU-compressed textures. |
| Render idling | Per-frame recomputation | Optimize rendering according to input and animation. |
| Saving and reusing render results | Per-frame recomputation | Draw fixed Noise or masks to a Render Target once and reference that texture afterward. |
| Baking lighting and shading | Per-frame recomputation | Bake the shading of fixed backgrounds into textures. |
| Adjusting update frequency per process | Per-frame recomputation | Move the whole screen, and update shadows and reflections only when their content changes. |
| Reducing draw calls | Draw commands and vertices | Consolidate objects that use the same Geometry and Material into an InstancedMesh. |
| Switching LOD | Draw commands and vertices | Switch models far from the camera to versions with fewer vertices. |
| Warming up the first render | First-time initialization | Prepare Shaders and textures during loading and run the actual rendering once. |
What they share is drawing only what is needed, at the needed resolution and only as many times as needed. The frame budget is a useful guide: about 16.7ms on a 60Hz screen and about 8.3ms at 120Hz. The browser has its own work to do within that time, so JavaScript and GPU processing cannot take up too much of it.
Rendering resolution deserves particular attention here. It has a large impact on full-screen Shaders and post-processing, where using the device's DPR (device pixel ratio) directly can mean processing more pixels than expected. Still, I recommend considering resolution adjustment last, after reviewing other sources of load. Otherwise, a heavy load unrelated to resolution can go unnoticed, and only the image quality ends up worse.
Adjusting the rendering resolution
Display size and rendering resolution
If the window is 1440×800, for example, a full-screen Canvas also has a display size of 1440×800. But applying a screen's DPR of 2 directly as the rendering scale makes the details finer, while the rendering resolution becomes 2880×1600 (4 times as many pixels) and the rendering load increases. At DPR 3 it is 4320×2400, or 9 times as many. As a baseline, each screen's DPR is treated as the maximum, and the rendering scale is adjusted by balancing appearance and load.
A full-screen Fragment Shader repeats its computation, texture samples, and output writes for each added pixel. Raising the resolution has a larger impact on work such as blur that samples an image many times per pixel. If intermediate Render Targets in post-processing use the same resolution, similar work is added for each pass, so looking only at the Canvas does not give the full picture of the load.
Translucent surfaces and particles also draw the same pixels repeatedly. They are drawn back to front, so each plane covering the screen adds another screenful of work. Pixel processing load needs to be considered as a product of the pixel count, the number of times pixels are drawn over, the work per pixel, and the number of passes.
Rendering resolution in Three.js
In Three.js, setPixelRatio() and setSize() determine the rendering resolution, and getDrawingBufferSize() shows the value. When changing this scale, compare 1, 1.5, 2, and so on while keeping the display size, weighing the difference in processing time against the coarseness of edges and details. The 4x or 9x increase applies to the pixel count, and processing time does not increase at the same ratio.
For the judgment, what is compared is processing time, not FPS. In Chrome DevTools, look at the requestAnimationFrame() callback in the Main track of the Performance panel and the processing time in the GPU section. The FPS and Frames sections only show up to the refresh rate, so 60FPS on a 60Hz screen does not tell you how much headroom remains.
Once the scale is decided, pass the smaller of that value and the device's DPR to setPixelRatio(). Doing so caps rendering at the chosen scale, and on a screen whose DPR is lower, it is not drawn beyond that DPR. For the earlier 1440×800, if the scale is set to 2, a DPR 3 screen still stays at a rendering resolution of 2880×1600, and a DPR 1 screen stays at 1440×800. (This 2 is only an example, and the appropriate value needs to be set for each project.)
renderer.setPixelRatio(Math.min(window.devicePixelRatio, 2));Dynamic resolution
If you narrow down the expected viewing environments, the rendering scale can be fixed to some extent. A high fixed value makes rendering heavy on less powerful devices, though, while a low one leaves more powerful devices with a coarse image despite having headroom. One way to accommodate that difference is dynamic resolution, which raises and lowers the scale according to FPS during viewing.
Still, a major caveat is that this only adjusts load from pixel processing. On screens dominated by JavaScript computation, CSS animations that run on the main thread, or vertex processing, lowering the resolution may only reduce image quality. FPS alone also cannot distinguish the causes. Comparing fixed scales to see whether processing time drops at a lower resolution helps check whether resolution is the cause. The adjustment itself is considered last, after reviewing other sources of load.
Here I use UsagiResolutionScaler, which I built and use, as an example to explain its decision logic and how to integrate it with Three.js.
Conditions for lowering and restoring the scale
UsagiResolutionScaler has three types of conditions for lowering the scale: short-term, long-term, and emergency. The defaults are listed below, with the measurement durations and the 30FPS threshold configurable through duration and emergency at construction.
| Decision | Default condition |
|---|---|
| Lower one level with the short-term check | 2 consecutive intervals (0.5 seconds or longer) where FPS excluding the slowest frame is below downFps |
| Lower one level with the long-term check | 2 consecutive intervals (2 seconds or longer) where average FPS including all frames is below downFps. A short interval completed at that point or later must also have average FPS below downFps |
| Lower one level with the emergency check | Frames below 30FPS continue, and 0.5 seconds elapse excluding the first slow frame |
| Decision pause duration | 0.5 seconds at startup and after a scale change, a return to the tab, or reset(). The emergency check also stops |
| Raise one level | Both the average FPS over the last 3 seconds and the latest interval's FPS exceed upFps |
| Measurement window for raising | Extends to 3, 6, 12, and 20 seconds according to the failure history |
The slowest frame is excluded from the short-term check to avoid lowering image quality for a momentary stall. Since that alone can keep excluding periodic delays, the long-term check includes all frames, as does its final short-interval check. A single long stall is not carried over into the next long-term interval, so it alone cannot trigger a long-term drop.
If the scale does not stabilize after being raised again, the measurement window needed for the next rise grows according to the failure history. The limit is 20 seconds, but this does not guarantee a rise after waiting that long.
On the other hand, as mentioned above, FPS does not rise above the refresh rate, so you cannot know whether the next level has enough headroom until you try it. Extending the measurement window does not eliminate the back-and-forth of raising and lowering the scale, and FPS and edge detail change while the higher level is being tried. The Canvas drawing buffer and Render Targets are also reallocated each time the scale changes, so it is best to keep the number of changes low.
UsagiResolutionScaler demo
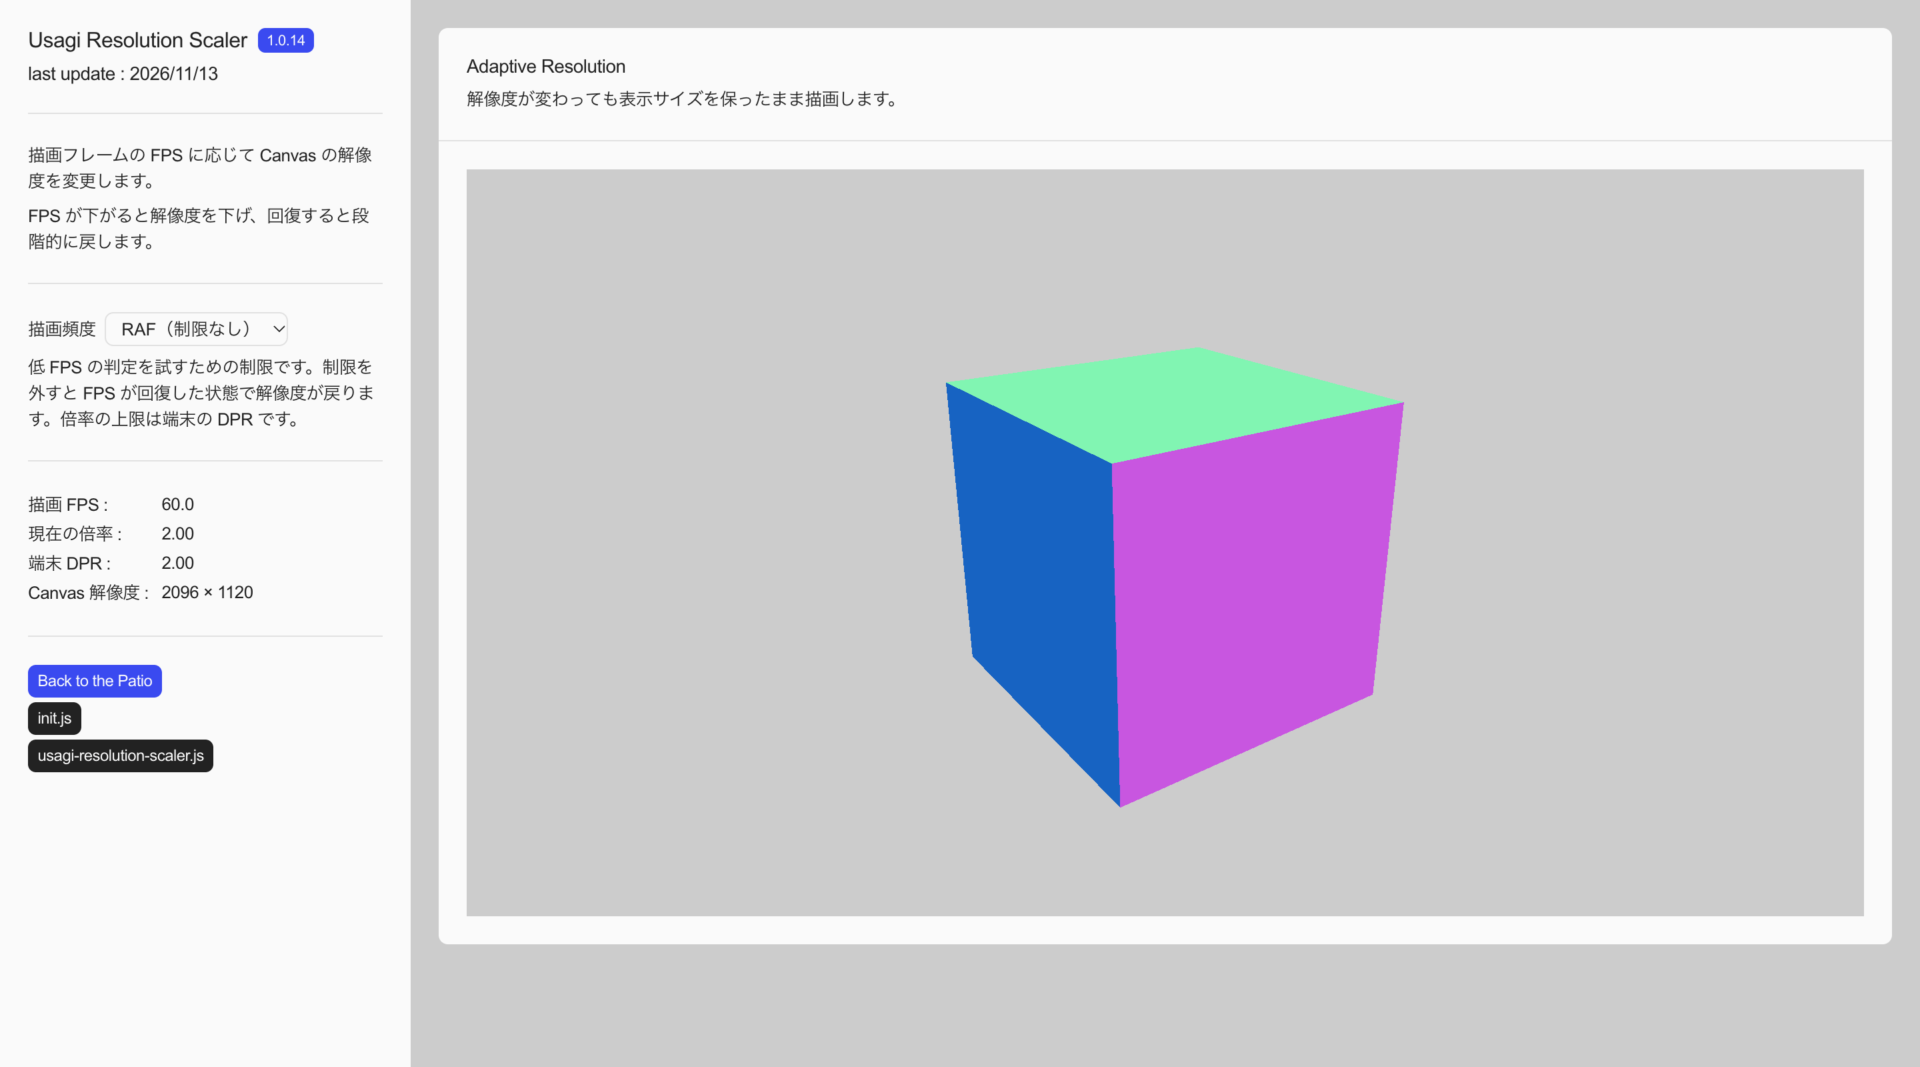
In the demo you can switch the rendering rate between RAF (no cap), a 30FPS cap, and a 20FPS cap, and watch the scale drop while capped and come back when the cap is removed. What it shows is the response to low FPS and the recovery.
- ※ The demo runs at the default 4 levels (2, 1.5, 1, and 0.75).
- ※ Because the rendering rate is capped on purpose, FPS does not recover during the cap even when the resolution drops. The actual load reduction can only be confirmed in the target implementation.
- ※ The failure histories for short-term and emergency drops persist across rendering-rate switches, so repeatedly applying and removing the cap lengthens the time until the scale returns. Reload to try it from the initial state.
- ※ The FPS display does not exclude the slowest frame, so it may not match the value used for the short-term lowering check. Its measurement window also differs from the long-term check.
Integrating with Three.js
The example below uses 4 levels.
import * as THREE from 'three';
import UsagiResolutionScaler from '../../src/usagi-resolution-scaler.js';

const resolution = new UsagiResolutionScaler({
    levels: [
        { scale: 2, downFps: 55 },
        { scale: 1.5, downFps: 55, upFps: 59 },
        { scale: 1, downFps: 55, upFps: 59 },
        { scale: 0.75, upFps: 59 }
    ]
});
downFps: 55 and upFps: 59 target 60FPS, with the gap between the thresholds intended to suppress back-and-forth caused by small fluctuations. However, only the short-term lowering check excludes the slowest frame, so even when that value is 55 or higher, the long-term check including all frames may lower the scale.
On a DPR 1 device the scales 2 and 1.5 cannot be used, so it starts from the scale 1 level. The DPR cap and the level chosen by load are held separately, so even if DPR changes through browser zoom or moving to another display, it can return to the load-based level once DPR goes back.
By default, measurement begins with the first update(). To exclude the initial rendering warmup, construct the scaler with autoStart: false and call resolution.start() when preparation is complete. Time spent waiting before the start is excluded, and decisions begin after a 0.5-second cooldown measured from the first update() after starting.
Pass update() the timestamp that the requestAnimationFrame() callback receives, and apply the scale when it returns true. The code below comes after creating the Renderer, Canvas, Scene and Camera, Render Target, and the outputScene and outputCamera that output the result to the screen. It keeps the CSS display size and also passes the drawing buffer's actual size to the Render Target.
const drawingSize = new THREE.Vector2();

function applyResolution() {
    renderer.setPixelRatio(resolution.scale);
    renderer.setSize(canvas.clientWidth, canvas.clientHeight, false);
    renderer.getDrawingBufferSize(drawingSize);
    renderTarget.setSize(drawingSize.x, drawingSize.y);
}

applyResolution();

function frame(time) {
    if (resolution.update(time)) {
        applyResolution();
    }
    renderer.setRenderTarget(renderTarget);
    renderer.render(scene, camera);
    renderer.setRenderTarget(null);
    renderer.render(outputScene, outputCamera);
    requestAnimationFrame(frame);
}

requestAnimationFrame(frame);
Since setPixelRatio() alone does not resize custom Render Targets, each pass and any resolution uniforms need to be updated according to their respective dimensions. Blur radii and point sizes specified in drawing pixels look larger on screen as the scale drops, so preserving their appearance also requires compensation for the scale.
The resize handling is shown below. It updates DPR and resets the measurement before applying the current size, but calling reset() leaves the started state, the scale, and the failure history that delays raising it again intact.
function resize() {
    resolution.setPixelRatio(window.devicePixelRatio);
    resolution.reset();
    applyResolution();
}

window.addEventListener('resize', resize);
DPR changes may not be caught by resize alone, so another option is to watch them with matchMedia() as in the MDN devicePixelRatio example.
When automatic adjustment does not fit
FPS measurement assumes the render loop runs continuously. With intermittent rendering that draws one frame only when there is input, the gaps between frames alone are judged as low FPS, and the scale drops even when the GPU has headroom. When combining it with idling, it is safer to render continuously only while something moves and not call update() when drawing a single frame in response to input. Call reset() when resuming continuous rendering.
- ※ In environments where rendering is limited to 30FPS, such as low power mode, or on screens whose refresh rate is below
downFps, lowering the resolution does not raise FPS, so it drops to the lowest level. - ※ With the configuration above it reaches the lowest level, 0.75x, within a few seconds. The drawing buffer becomes 3/4 of the display size on each side. On a DPR 3 device, each side is 1/4 of what it would be when rendering at the device's DPR, and the pixel count is 1/16. On screens where coarse edges or text are not acceptable, keeping the floor higher, such as making the lowest level 1, prevents it from getting too coarse.
Source code
Reducing Shader and texture load
In a Fragment Shader, the computation and texture sample count per pixel affect load as directly as the number of pixels drawn. For work that samples a texture many times per pixel, like a full-screen blur, you can reduce the sample count or process in a downscaled Render Target and then upscale. Comparing Various Blur Implementations and Relative Load compares blur sample counts and load.
The basic rule for textures is to match the size needed for display. JPEG and PNG are decoded before upload to the GPU, so a small file does not mean low GPU memory use: a 4096×4096 RGBA texture uses 64MiB, or about 85MiB including mipmaps. GPU compression is another option here.
KTX2 is a container format for textures, and Three.js's KTX2Loader transcodes the Basis Universal textures inside it into a format suited to the device. If a GPU-compressed format is available, it may reduce GPU memory use and the amount of data uploaded to the GPU, but compression artifacts vary with the source image. For images containing gradients or text in particular, comparing appearance matters as well as size.
Render idling
Even at a lower rendering resolution, redrawing an unchanged image means repeating the same computation every frame. It is better to stop rendering while nothing changes and resume on input, resizing, or when assets finish loading. If the animation is still following a target or has remaining inertia after input stops, though, rendering is needed until the difference from the target is small enough.
In hidden tabs, most browsers stop requestAnimationFrame() itself. A Canvas outside the viewport needs separate control, and IntersectionObserver can detect when it leaves the visible area so rendering can stop. In both cases, the stopped time enters the next frame's elapsed time on resume, so if the simulation should advance, how to apply that time also needs to be decided. The considerations when combining this with automatic adjustment are the same as for intermittent rendering described above.
Saving and reusing render results
Once fixed Noise, masks, blurred backgrounds, and similar content have been drawn to a Render Target, later frames only need to reference that texture. Regeneration is needed only when the content, the generating Camera, or the Render Target size changes. A Render Target that follows the rendering resolution will also need regeneration when automatic adjustment changes the scale. This does not help content that changes every frame, and holding the result requires GPU memory.
Baking lighting and shading
Dynamic lighting and shadows add per-frame work as the number of lights and shadow map renders increases. For fixed backgrounds whose lighting and shading also remain unchanged, it is better to bake the shading into light maps or AO maps in advance. This reduces dynamic processing, but the extra textures add to data size and GPU memory use.
Adjusting update frequency per process
Shadow maps add a render of the objects as seen from each shadow-casting light. Even if the whole screen moves, whether the shadows also need rebuilding every frame is a separate question. The following example stops automatic updates of all shadow maps, assuming that settings such as the lights' castShadow are complete and each light's shadow.autoUpdate is left at its default of true.
renderer.shadowMap.enabled = true;
renderer.shadowMap.autoUpdate = false;
renderer.shadowMap.needsUpdate = true;
After the first render, renderer.shadowMap.needsUpdate = true allows an update only when lights, shadow-casting objects, the shadow Camera, or similar settings change. For per-light control, the global renderer.shadowMap.autoUpdate = true needs to remain enabled while using light.shadow.autoUpdate and light.shadow.needsUpdate.
Updating every few frames is also an option for slowly changing reflections, but it looks wrong when they trail behind objects. Even if the average work goes down, individual update frames can become heavier, so the interval and the cost of one update need separate consideration.
Reducing draw calls
On screens with many objects, draw commands or vertex processing can become a bottleneck before pixel processing does. The calls and triangles values in renderer.info.render give the draw call and triangle counts. However, renderer.info resets with each render(), so only the last render remains in a multipass setup. Counting the whole frame requires renderer.info.autoReset = false, followed by renderer.info.reset() after rendering finishes and the values have been read.
Objects sharing the same Geometry and Material can be combined with InstancedMesh, while BatchedMesh can group different Geometry with a shared Material to reduce draw calls. Vertex and pixel processing remain, though, so the benefit is limited when the Shader is heavy. Also, InstancedMesh culls the whole set as a single object and does not sort instances against each other, so the draw order can break for transparent objects.
Switching LOD
LOD switches distant models to versions with fewer vertices. Three.js LOD is based on distance from the camera, though, so the same thresholds can look different when the field of view or display size changes. Alongside checking silhouette changes at the actual display size, the data size and memory needed to hold several models also matter. If lightening a single model is enough, that is simpler to manage.
Warming up the first render
In Three.js, Shader compilation and texture uploads to the GPU happen the first time that Material or texture is used for rendering. Left to happen then, they can cause a brief FPS drop or stall on the first display. In such cases, initialization can be moved into the loading phase.
The state to prepare is the one used for actual rendering, including loaded images and models and the lighting and environment settings. In a setup that renders through a Render Target, as above, the output color space and other settings differ from direct Canvas output, so the Shaders are not necessarily the same. The example below follows the actual rendering order, drawing once to both the Render Target and the Canvas.
renderer.initTexture(texture);

renderer.setRenderTarget(renderTarget);
await renderer.compileAsync(scene, camera);
renderer.render(scene, camera);

renderer.setRenderTarget(null);
await renderer.compileAsync(outputScene, outputCamera);
renderer.render(outputScene, outputCamera);
compileAsync() can prepare Material Shaders including those of hidden and off-screen objects, but it does not upload textures. Textures of objects absent from the warm-up render need uploading with initTexture(), and Shaders for Materials swapped in later also need separate preparation. Moving initialization earlier does not reduce per-frame work, so how much to prepare is a balance with the wait before display.
The number of lights and the shadow settings are also part of the Shader. Adding lights, toggling visible, or changing a light's castShadow while displaying can rebuild the Shaders of affected Materials. If an effect switches them, either run both states once during loading or set intensity to 0 instead of turning the light off, which leaves the Shader unchanged. A shadow-casting light keeps rendering its shadow map even with intensity at 0, though.
Closing
The measures covered here mostly come with trade-offs. Lowering the rendering scale makes edges and details coarser, baking and LOD require data and memory, and updating reflections less often makes them lag behind movement. In practice, the effect needs to be measured for each screen and weighed against what it costs. What matters is drawing only what is needed, at the needed resolution and only as many times as needed. These measures are not about cutting back on the visual result; they are one way to make the intended result work across more viewing environments.
References
- ※ This article is an AI translation of the Japanese original.